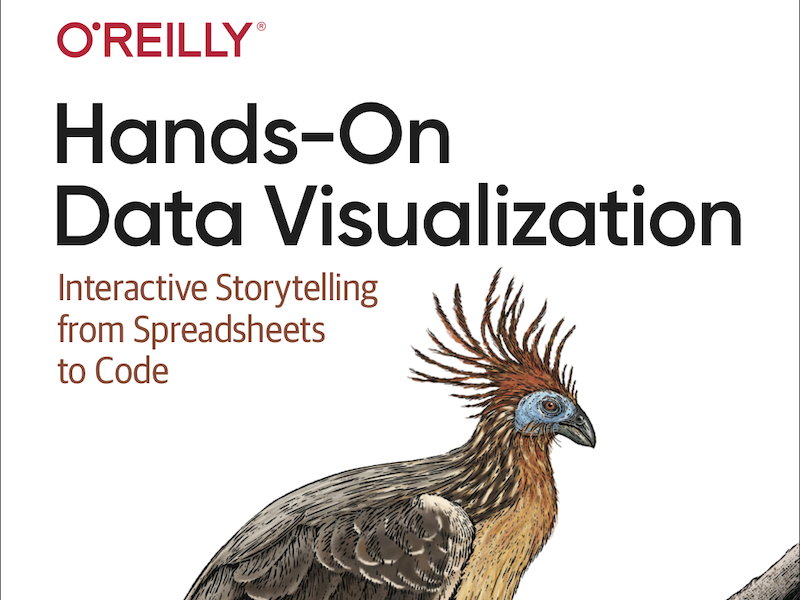
Hands-On Data Visualization: Interactive Storytelling from Spreadsheets to Code
←Back to list of resources
Tell your story and show it with data, using free and easy-to-learn tools on the web. This introductory book teaches you how to design interactive charts and customized maps for your website, beginning with easy drag-and-drop tools, such as Google Sheets, Datawrapper, and Tableau Public. You’ll also gradually learn how to edit open-source code templates like Chart.js, Highcharts, and Leaflet on GitHub. Open-access web edition of book to be published by O'Reilly Media, 2021.
United States, Hartford, CT
Contributed by: Jack Dougherty
Language: English
License: Other
